Telkom Athon Dashboard
A Dashboard to Streamline Data and Insights of Telkom Athon Learning Program
What is Telkom Athon?
Telkom Athon is a program that accommodates Telkom employees to improve digital capabilities. The program supports and facilitates employee development to upgrade Digital Skills and their potential with the 4C approach (Course, Coach, Community, and Competition / Challenge) so that they can have a significant impact on the development of Digital Talent for companies. They provide classes equipped with curriculum and mentors to help employee improve their digital skills.
Project Details
Role :
UX Design Lead, User Interviews, Usability Testing
Client :
Telkom Indonesia (professional work)
Tools :
Figma, Miro, QuantUX
Project Duration :
Aug - Okt 2023
Background
Telkom Athon is a high-profile event designed to nurture technological talent within Telkom Indonesia, with participants moving through various stages: selection, coursework, and competition.
However, managing participant data across multiple platforms (Google Docs, Sheets, Drive) resulted in inefficient workflows. Product Owners and other stakeholders lacked a unified tool to track progress, score participants, and gain real-time insights.
Our team was tasked to develop a unified dashboard to centralize data, simplify management, and provide real-time insights to stakeholders, transforming the experience from frustrating to seamless.
Problem Discovery
Senior leaders couldn’t get the information they needed fast enough to make informed, real-time decisions
At its core, Telkom Athon had an inefficiency problem. Participant data—names, scores, performance progress—was stored across Google Docs, Sheets, and Drives. Each stage of the competition created new layers of data to manage, and with no central system, this led to:
1. Manual Data Handling:
Data was scattered across various platforms, making it difficult to manage and update.
2. Lack of Real-Time Insights:
Stakeholders could not track participant progress or receive timely updates.
3. Inconsistent Documentation:
Participant profiles and scoring were difficult to document, leading to challenges in designing tailored competition journeys.

How might we help stakeholders create progress report and gather insight in real time progress?
Solutions
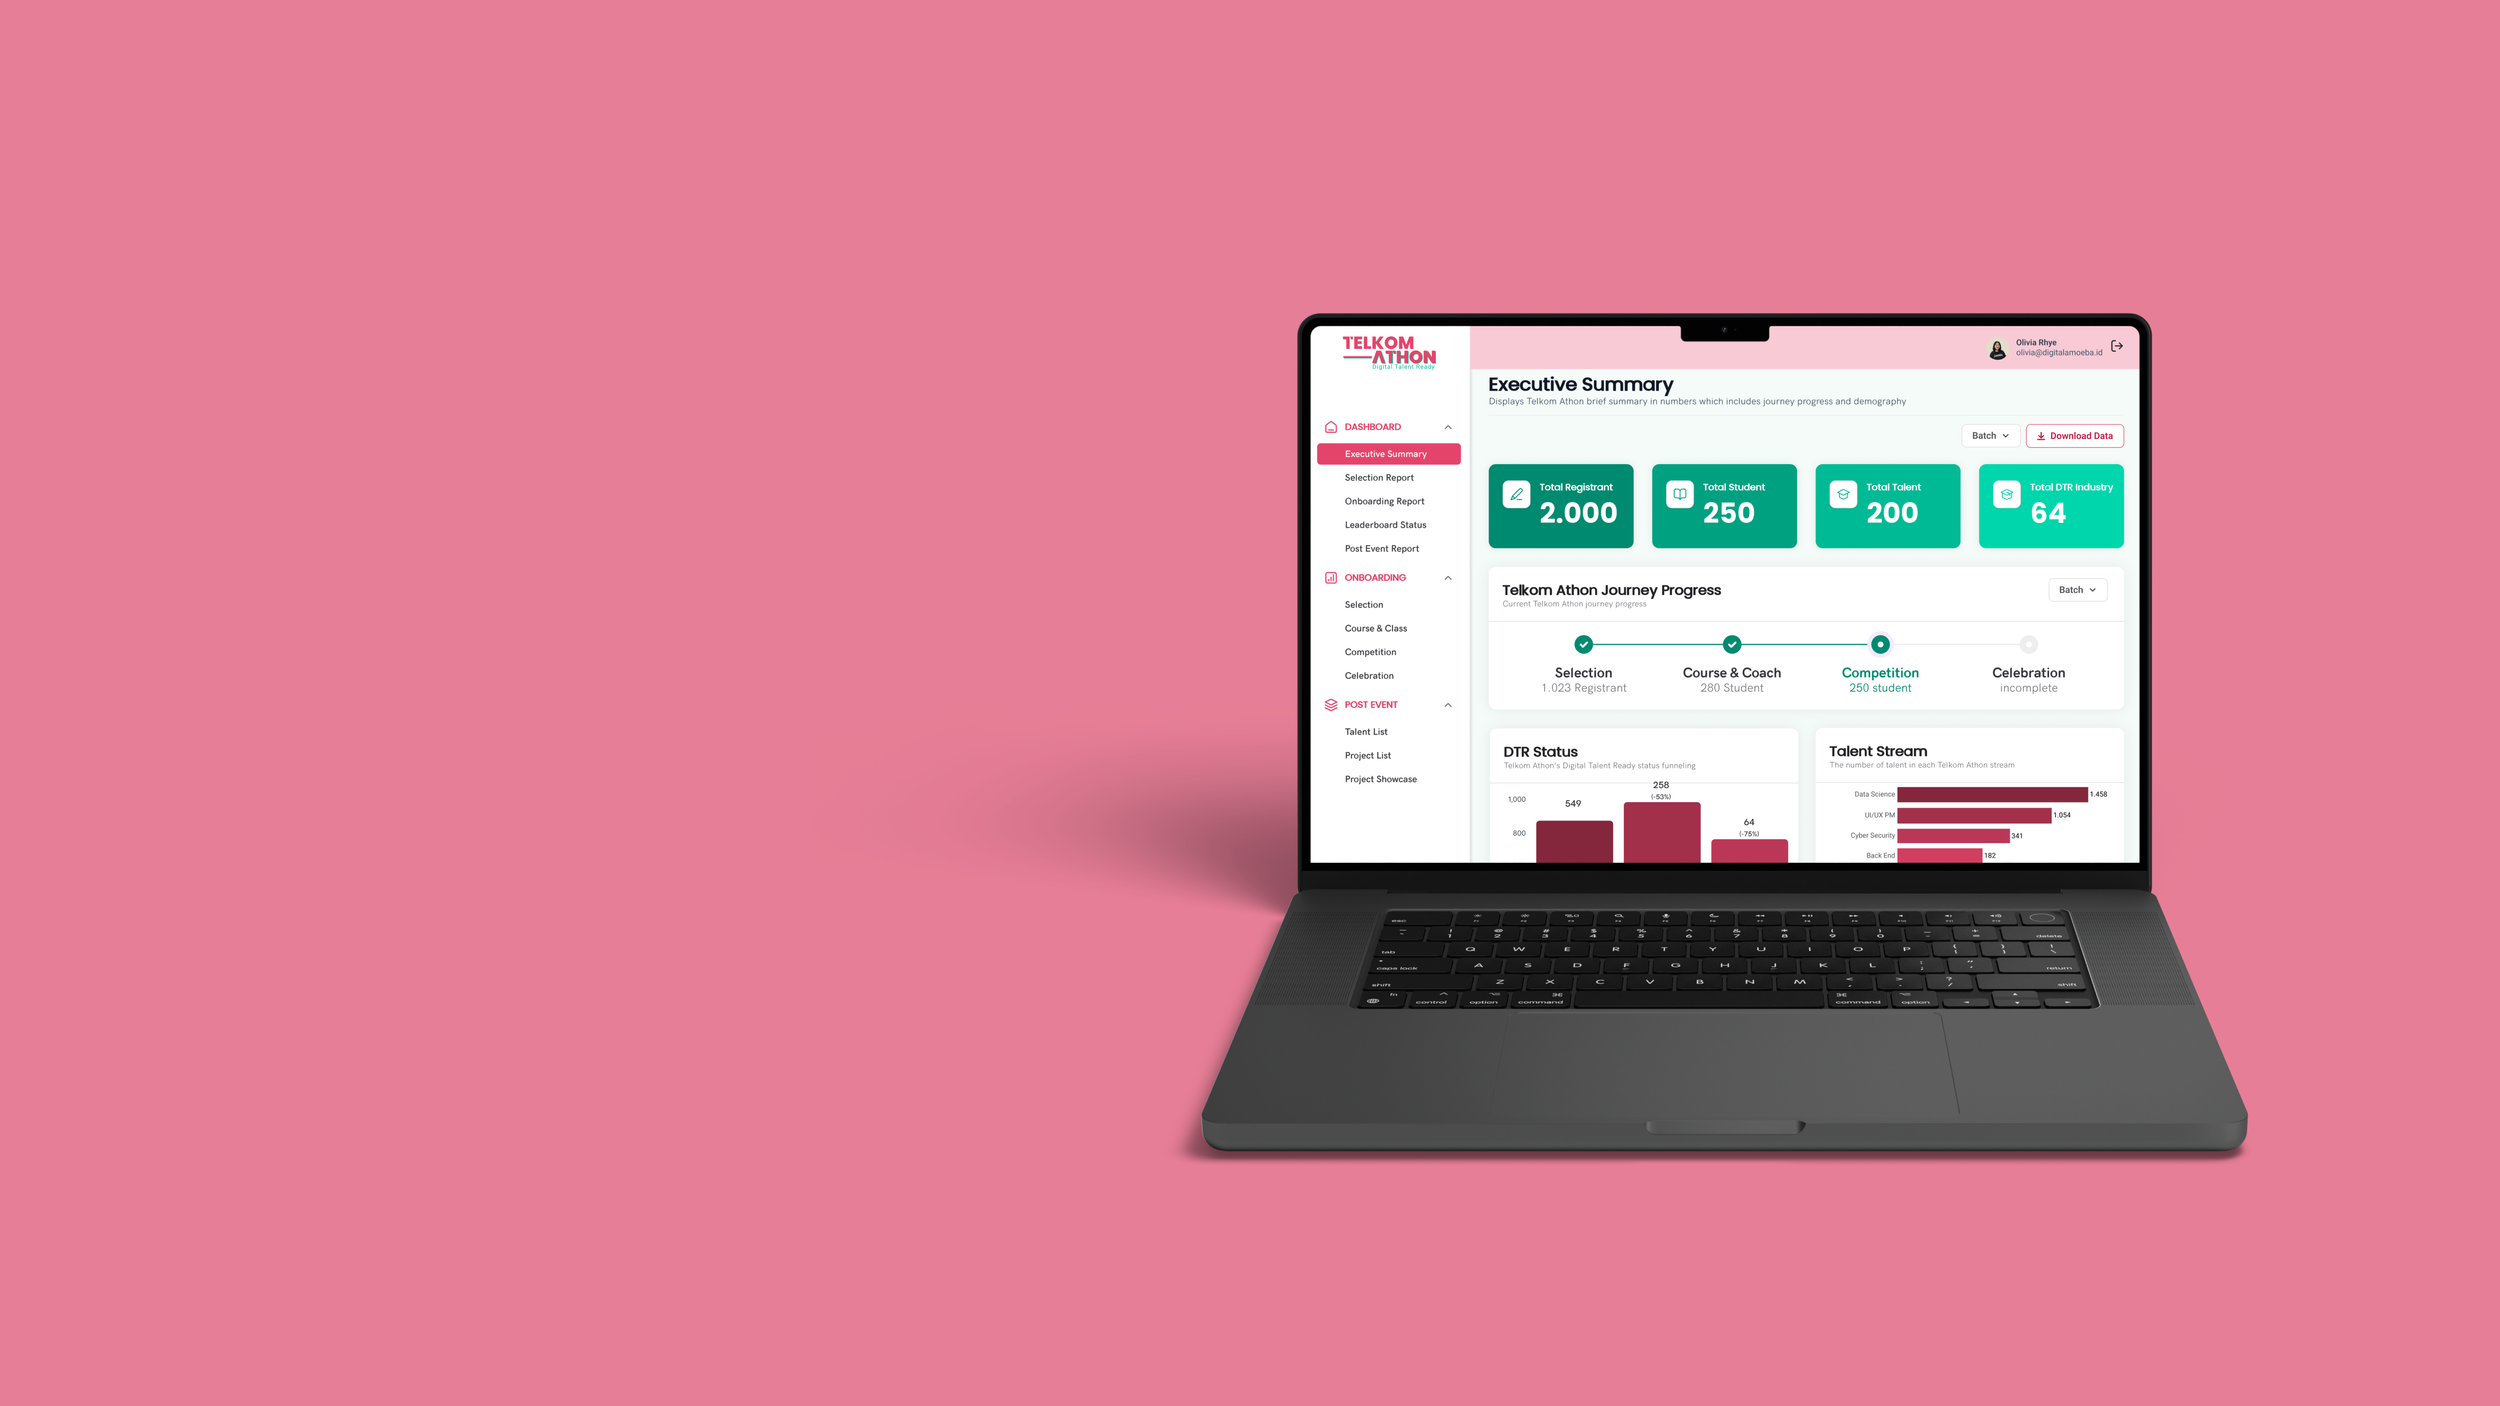
A dashboard to facilitate efficient data management, progress tracking, and real-time reporting
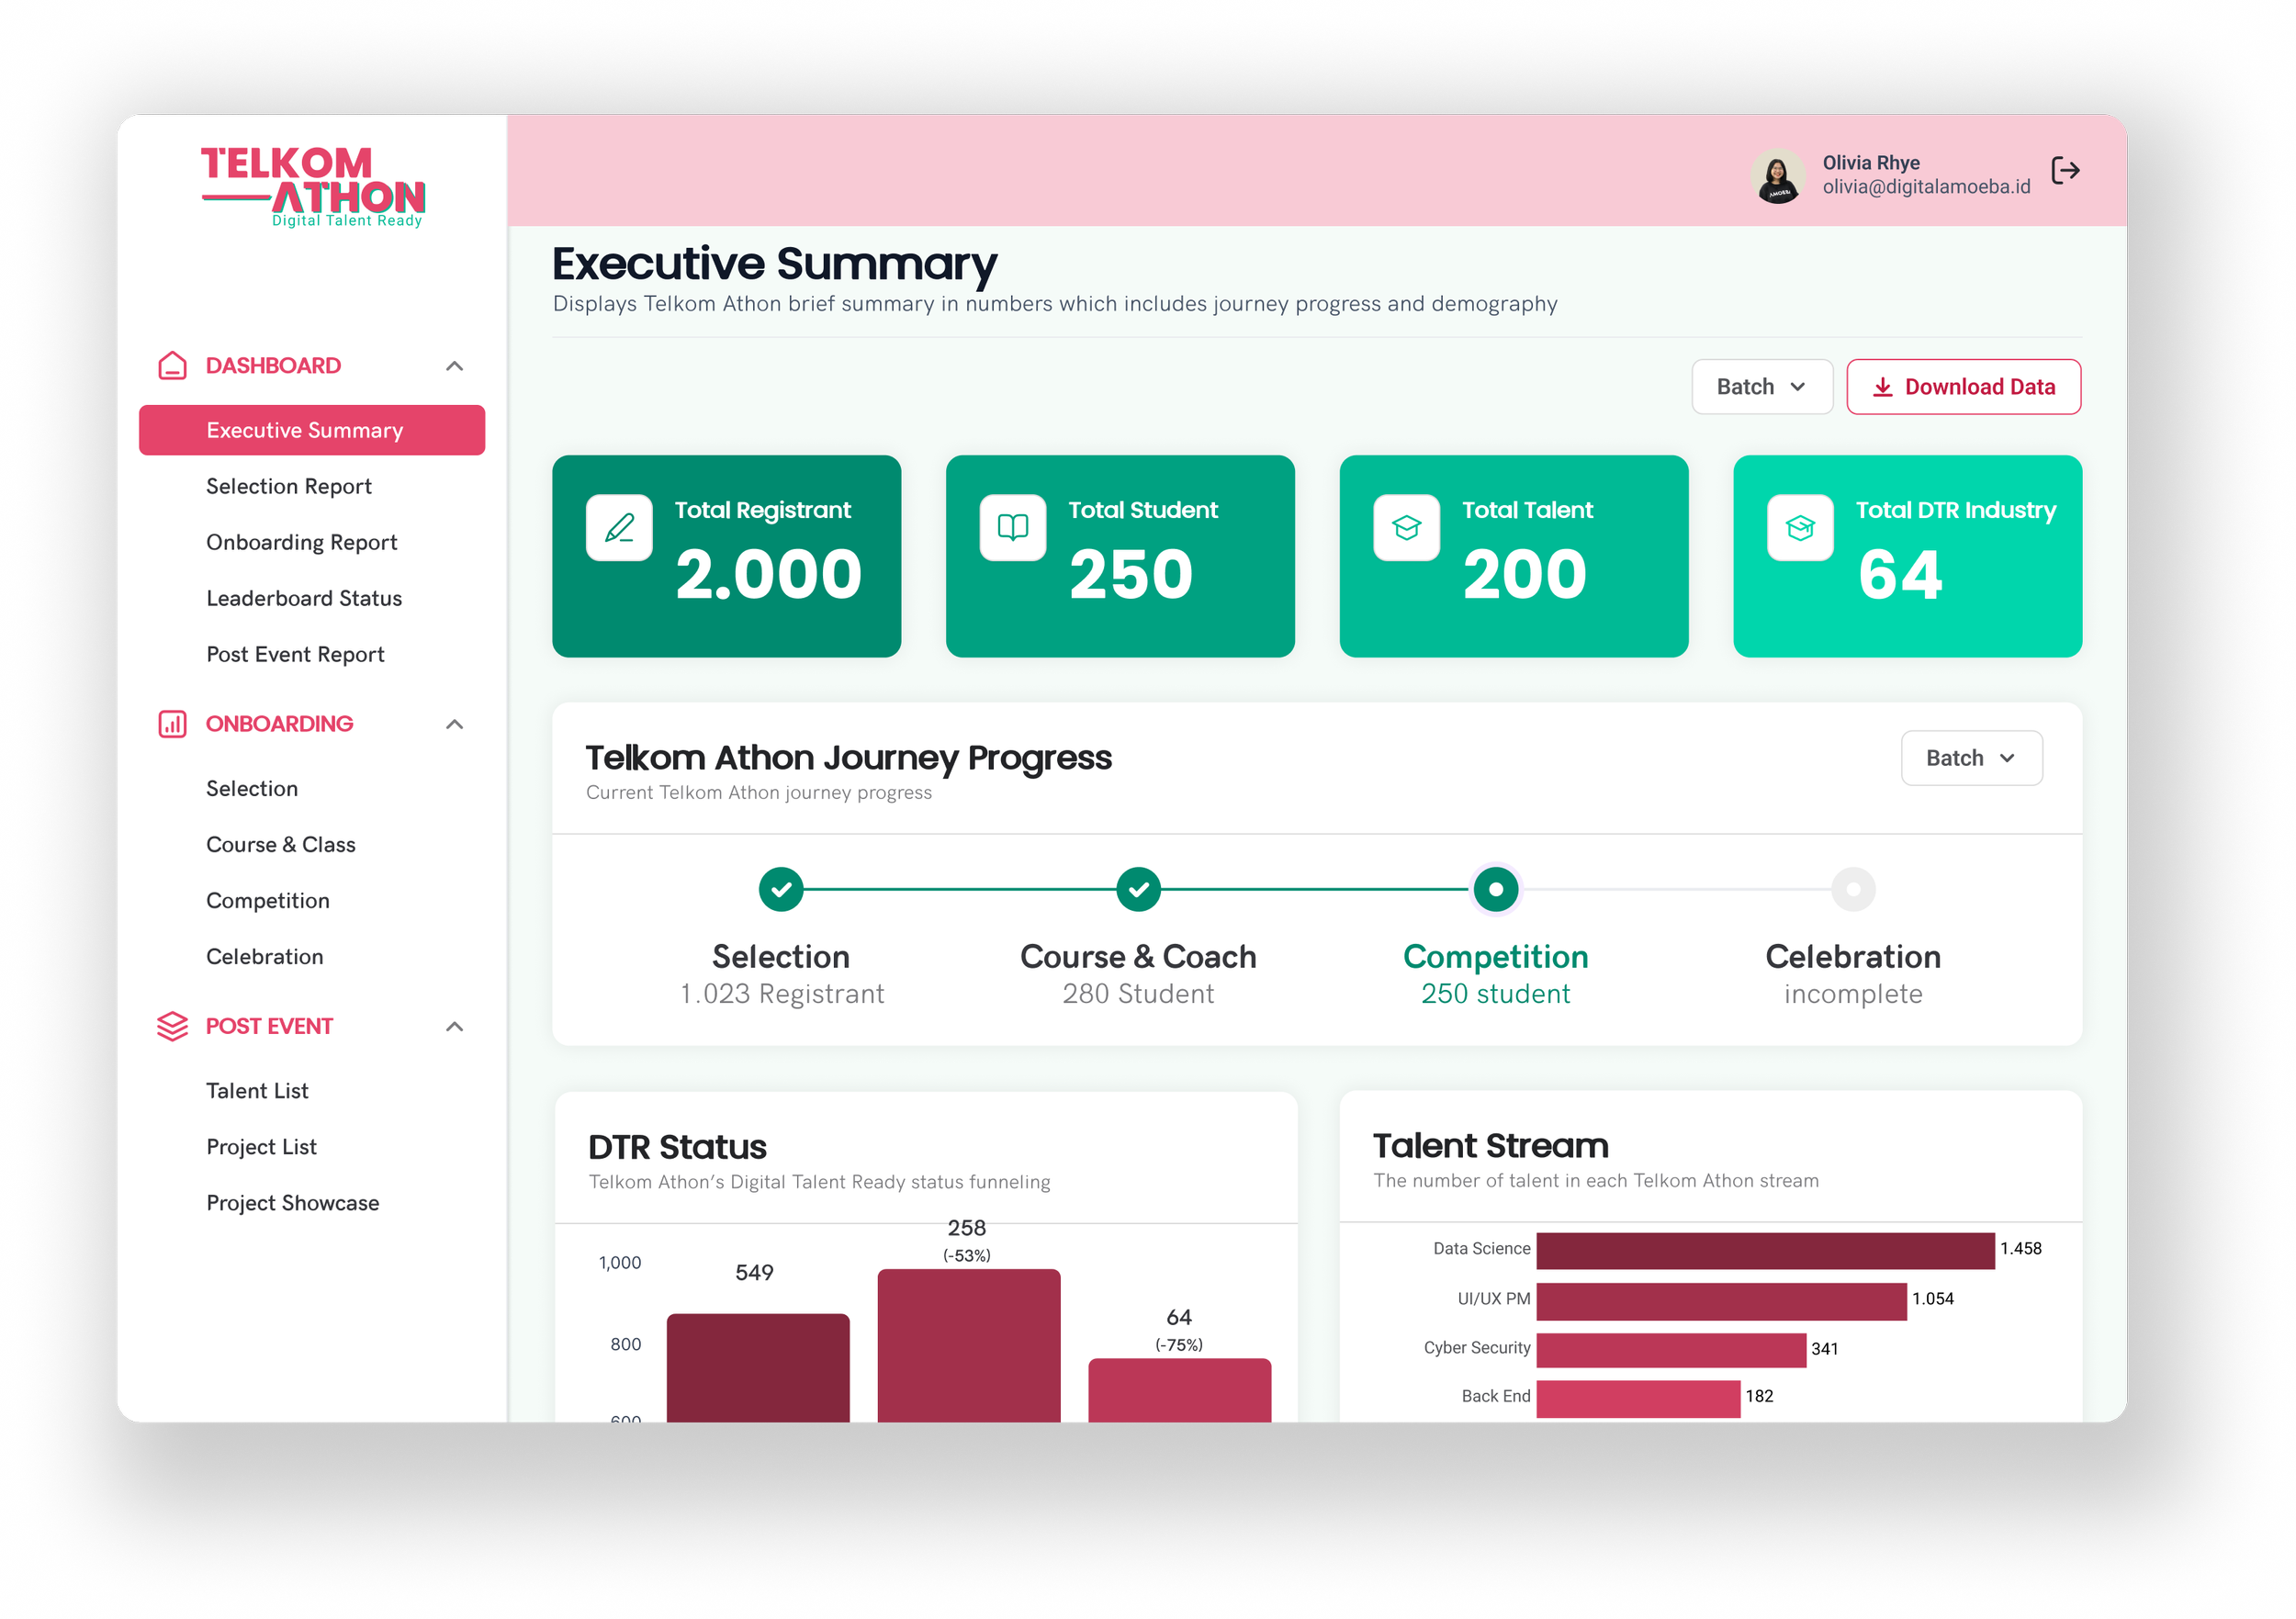
1. Executive Summary
Provides insights from the available data that are easy to read and updated in real-time.

2. Leaderboard
Displays the learning progress of talents, enabling in-depth assistance or adjustments based on students’ needs.
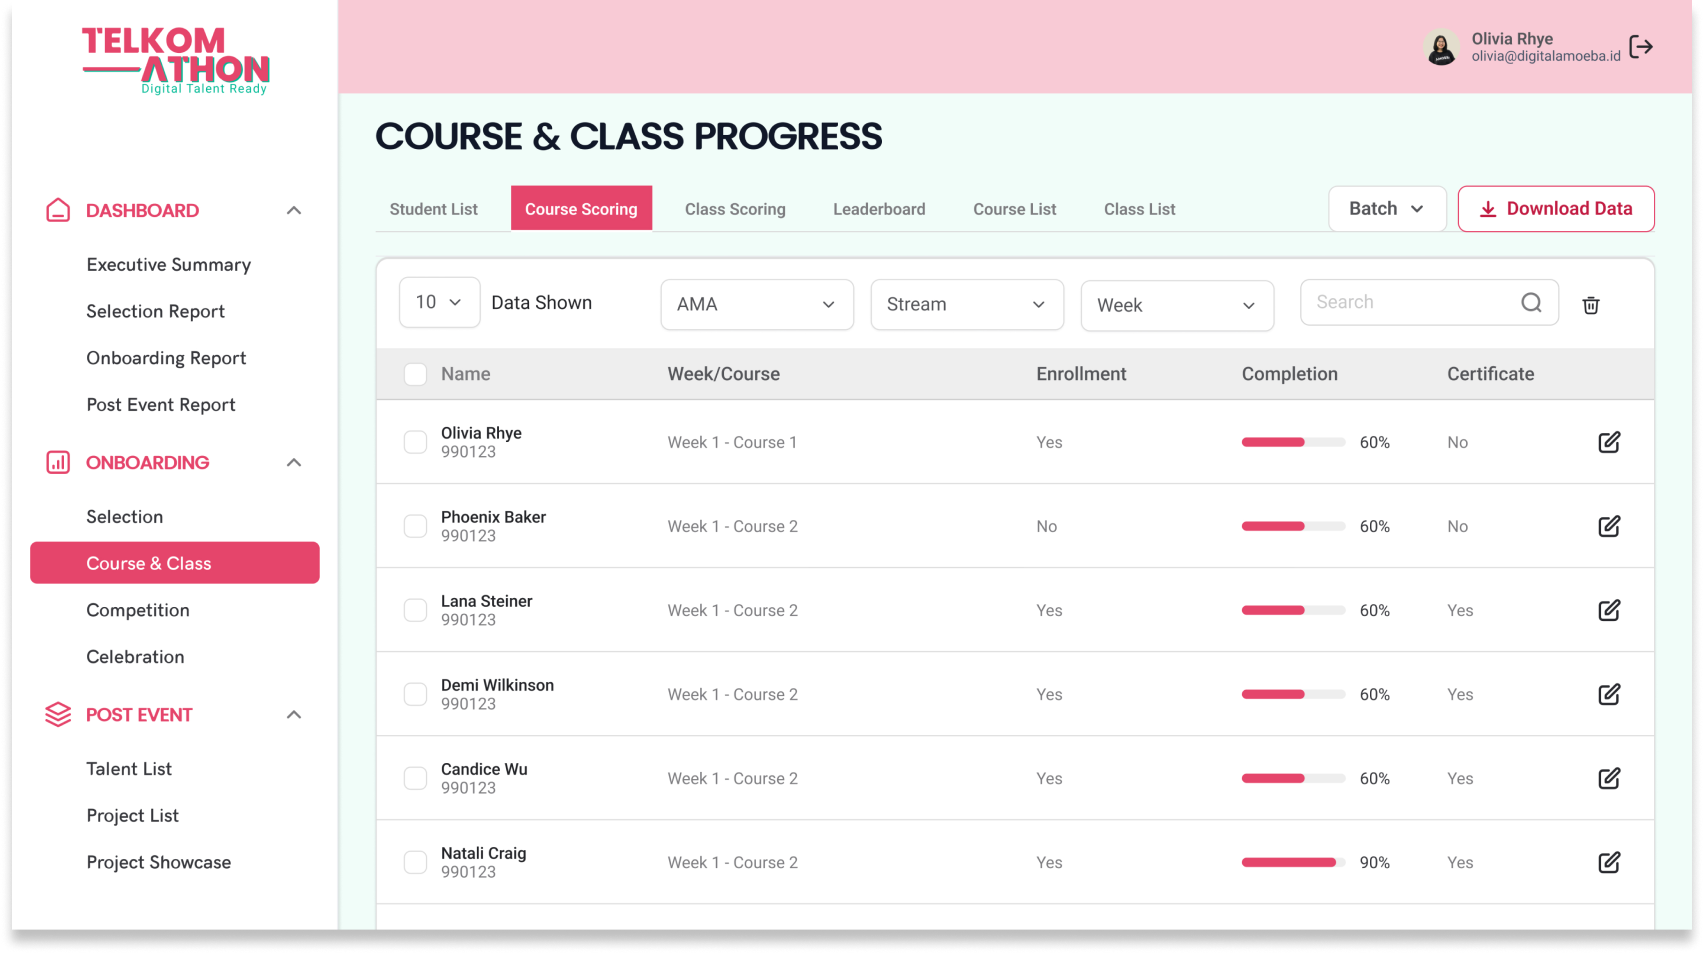
3. Course & Class Scoring
Program owner or facilitators can manage data, input, or update scores and generate reports.
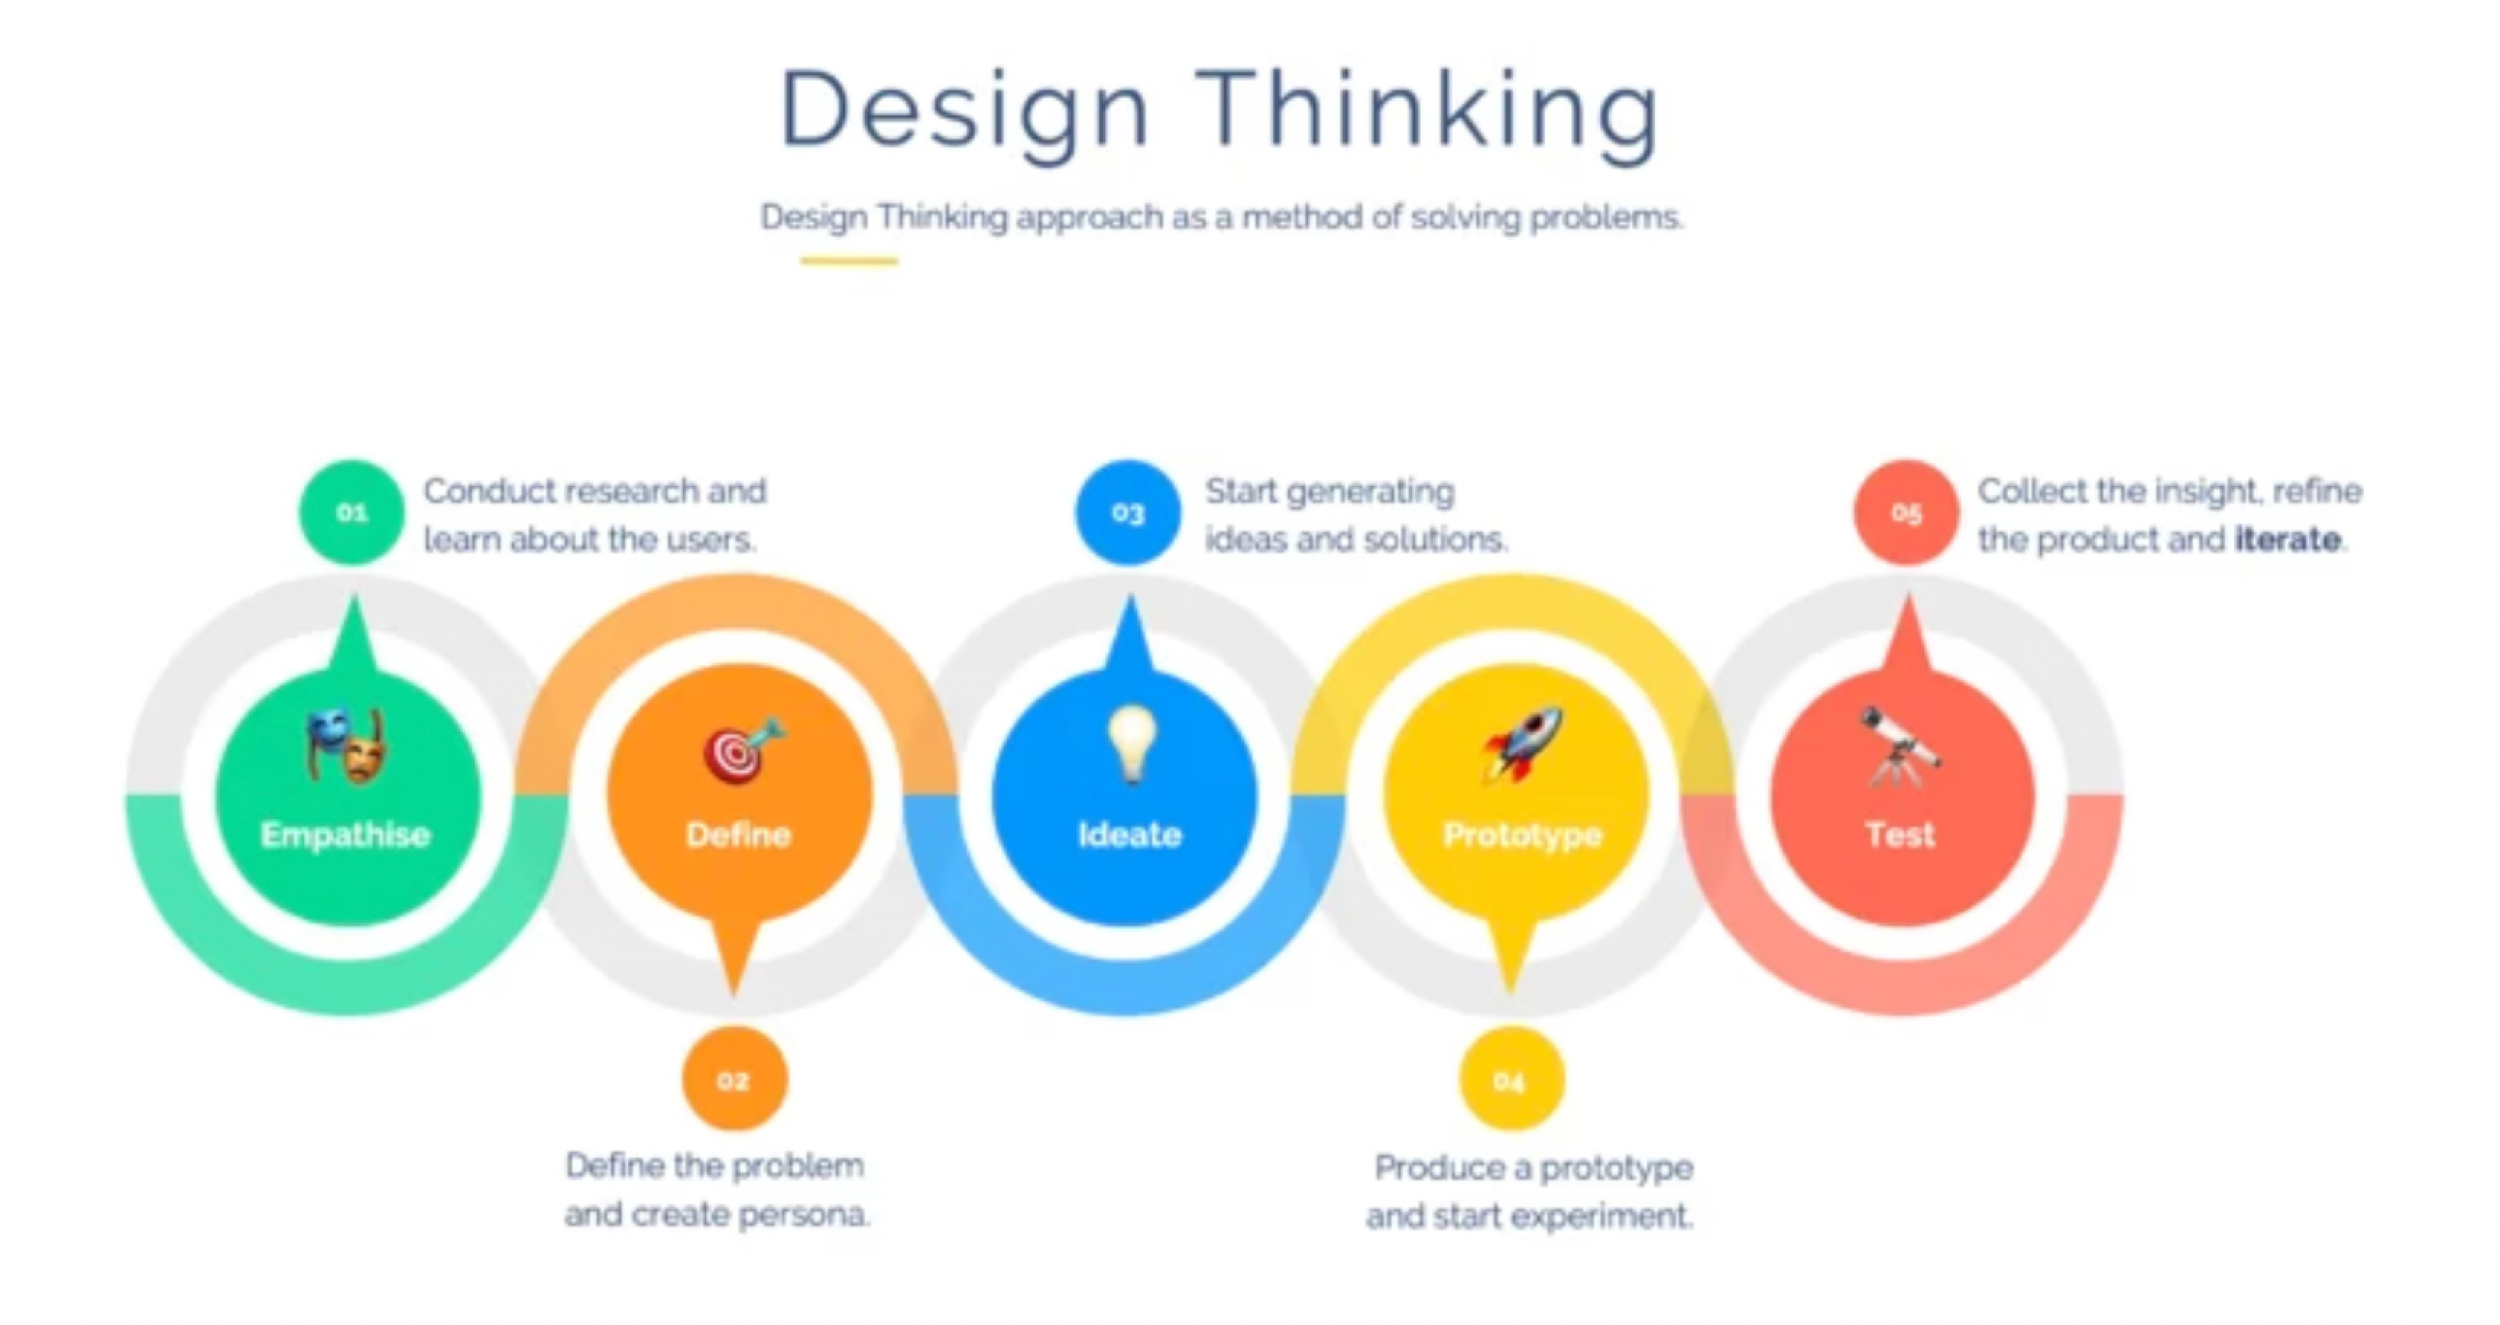
Design Process
We used Design Thinking approach to solve this problem and came up with a solution based on user needs.
Understanding Users’ Pain Points Before Designing
User Research & Interview
First, we needed to know exactly what users were struggling with. We conducted user research and interviews with 3 key stakeholders:
Product Owners who track and monitor end-to-end program progress.
Mentors who handle mentoring daily operations.
Senior Leaders who required quick access to high-level insights at glance.

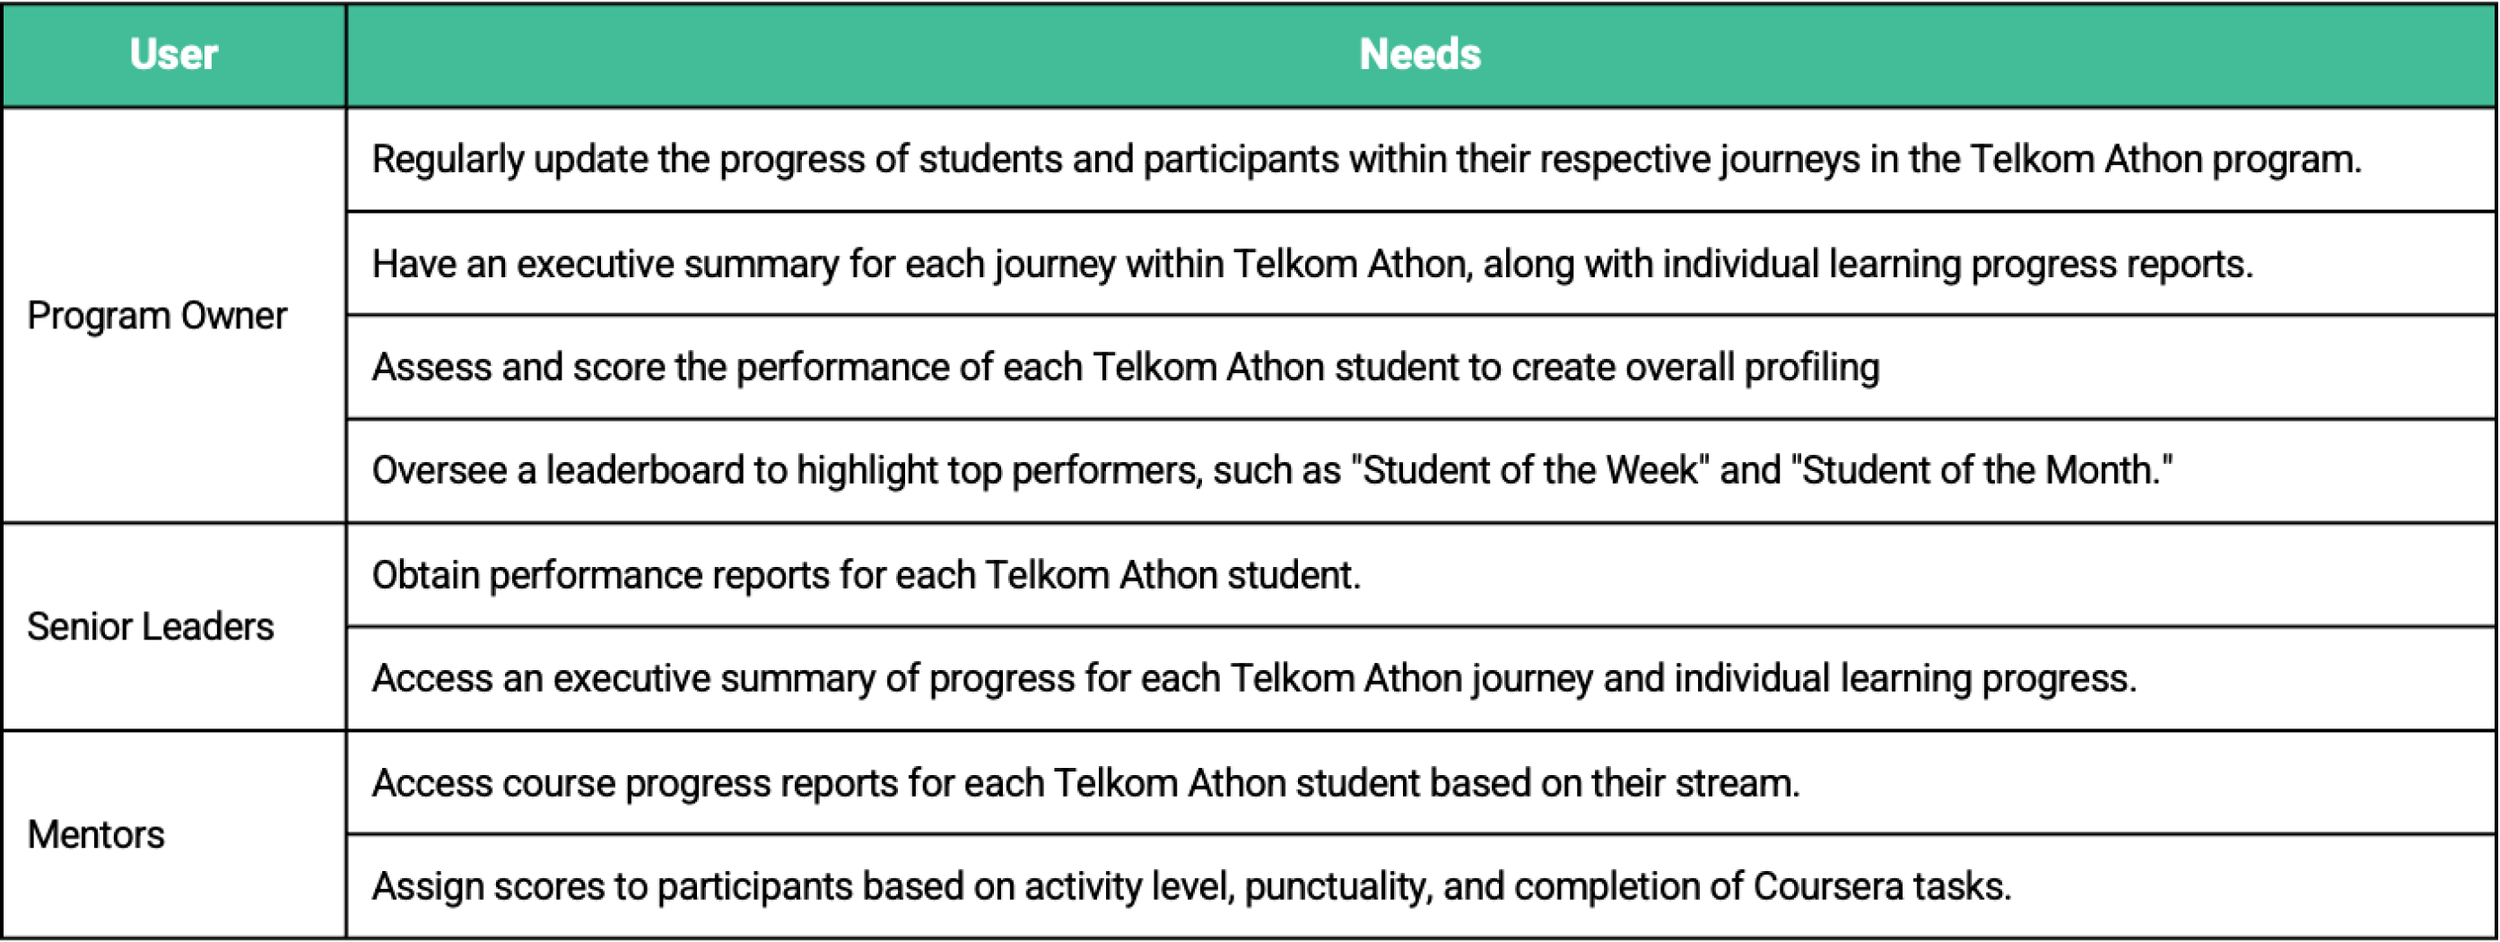
User Needs
From these user research and interviews, we uncovered their user needs. created detailed user personas and user stories to inform every design decision. It was crucial that our solution directly addressed the specific challenges faced by each user type.
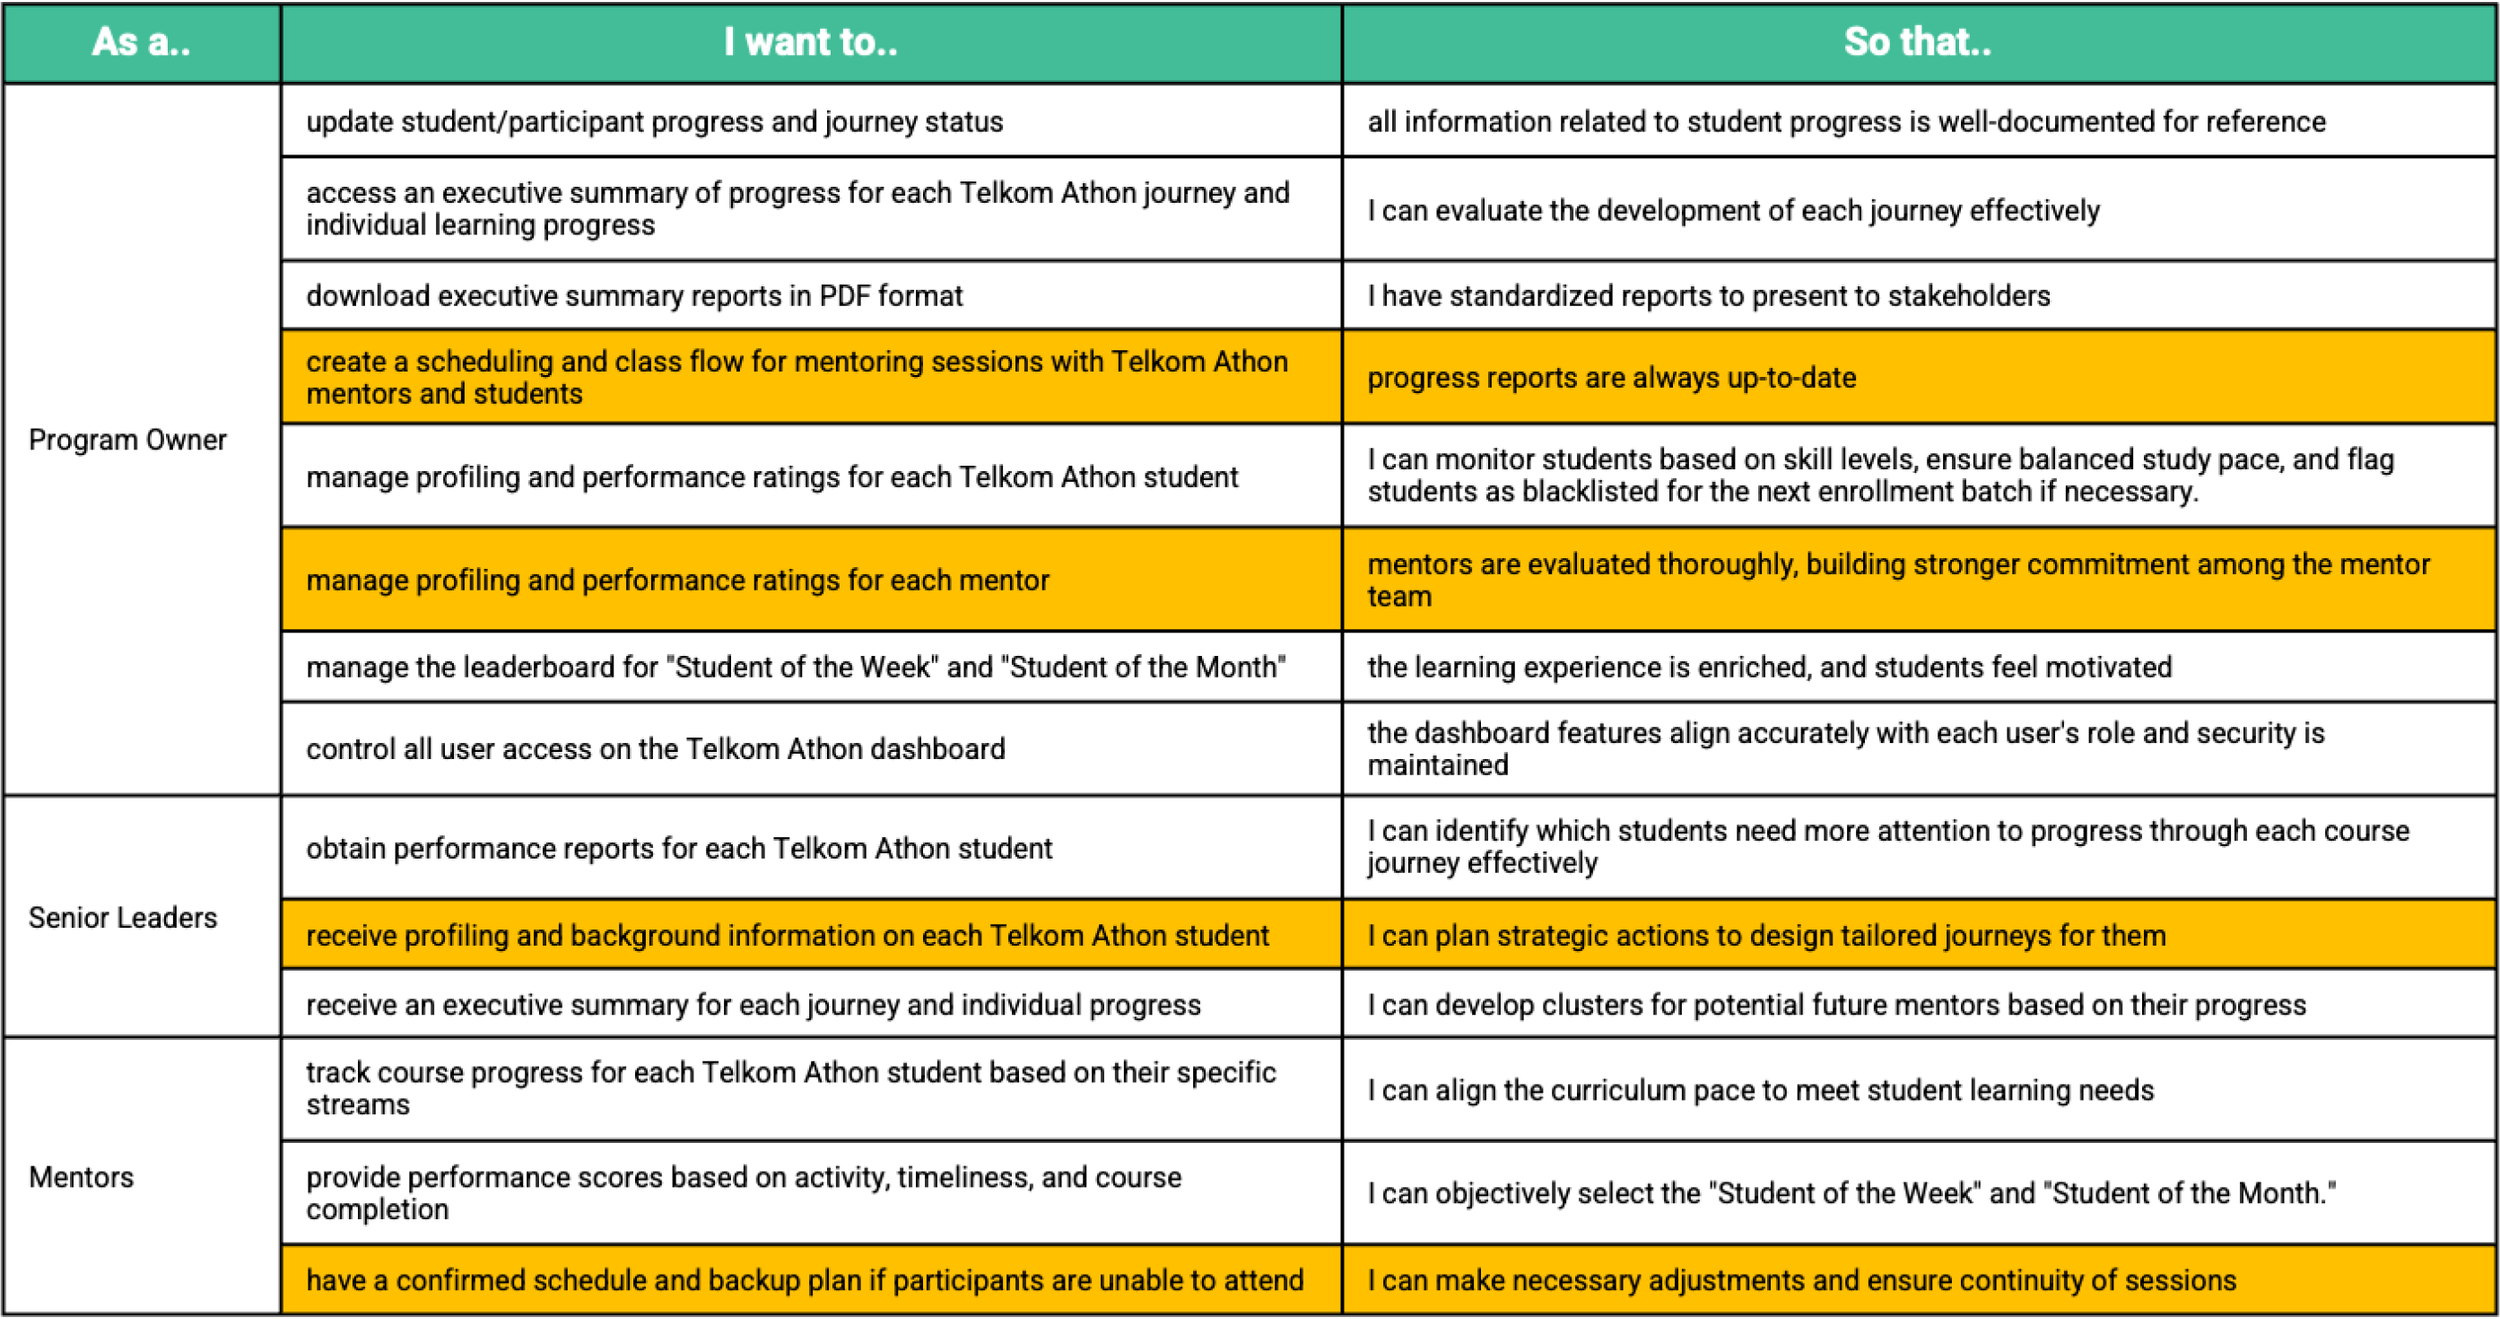
User Stories
We used user stories to break down the user’s needs, motivations, and expected outcomes in all scenarios relevant to their jobs, and as a basis for developing the feature-set. We came up with total 14 user stories.
Unfortunately, we have time as a constraint..
Due to the tight project duration, we changed our strategy and focus on developing a minimum viable product. It means we need to prioritize the feature to be delivered in the first launch.
So instead of developing the full-fledged feature, we scoped down our focus to fulfill 10 user stories, which focus on executive summary, monitoring journey progress, and student scoring.
This 10 user stories was believed would meet user needs and expectation of all users with optimum effort from team member. So in this case study, we will focus on offering this features as our minimum viable product:

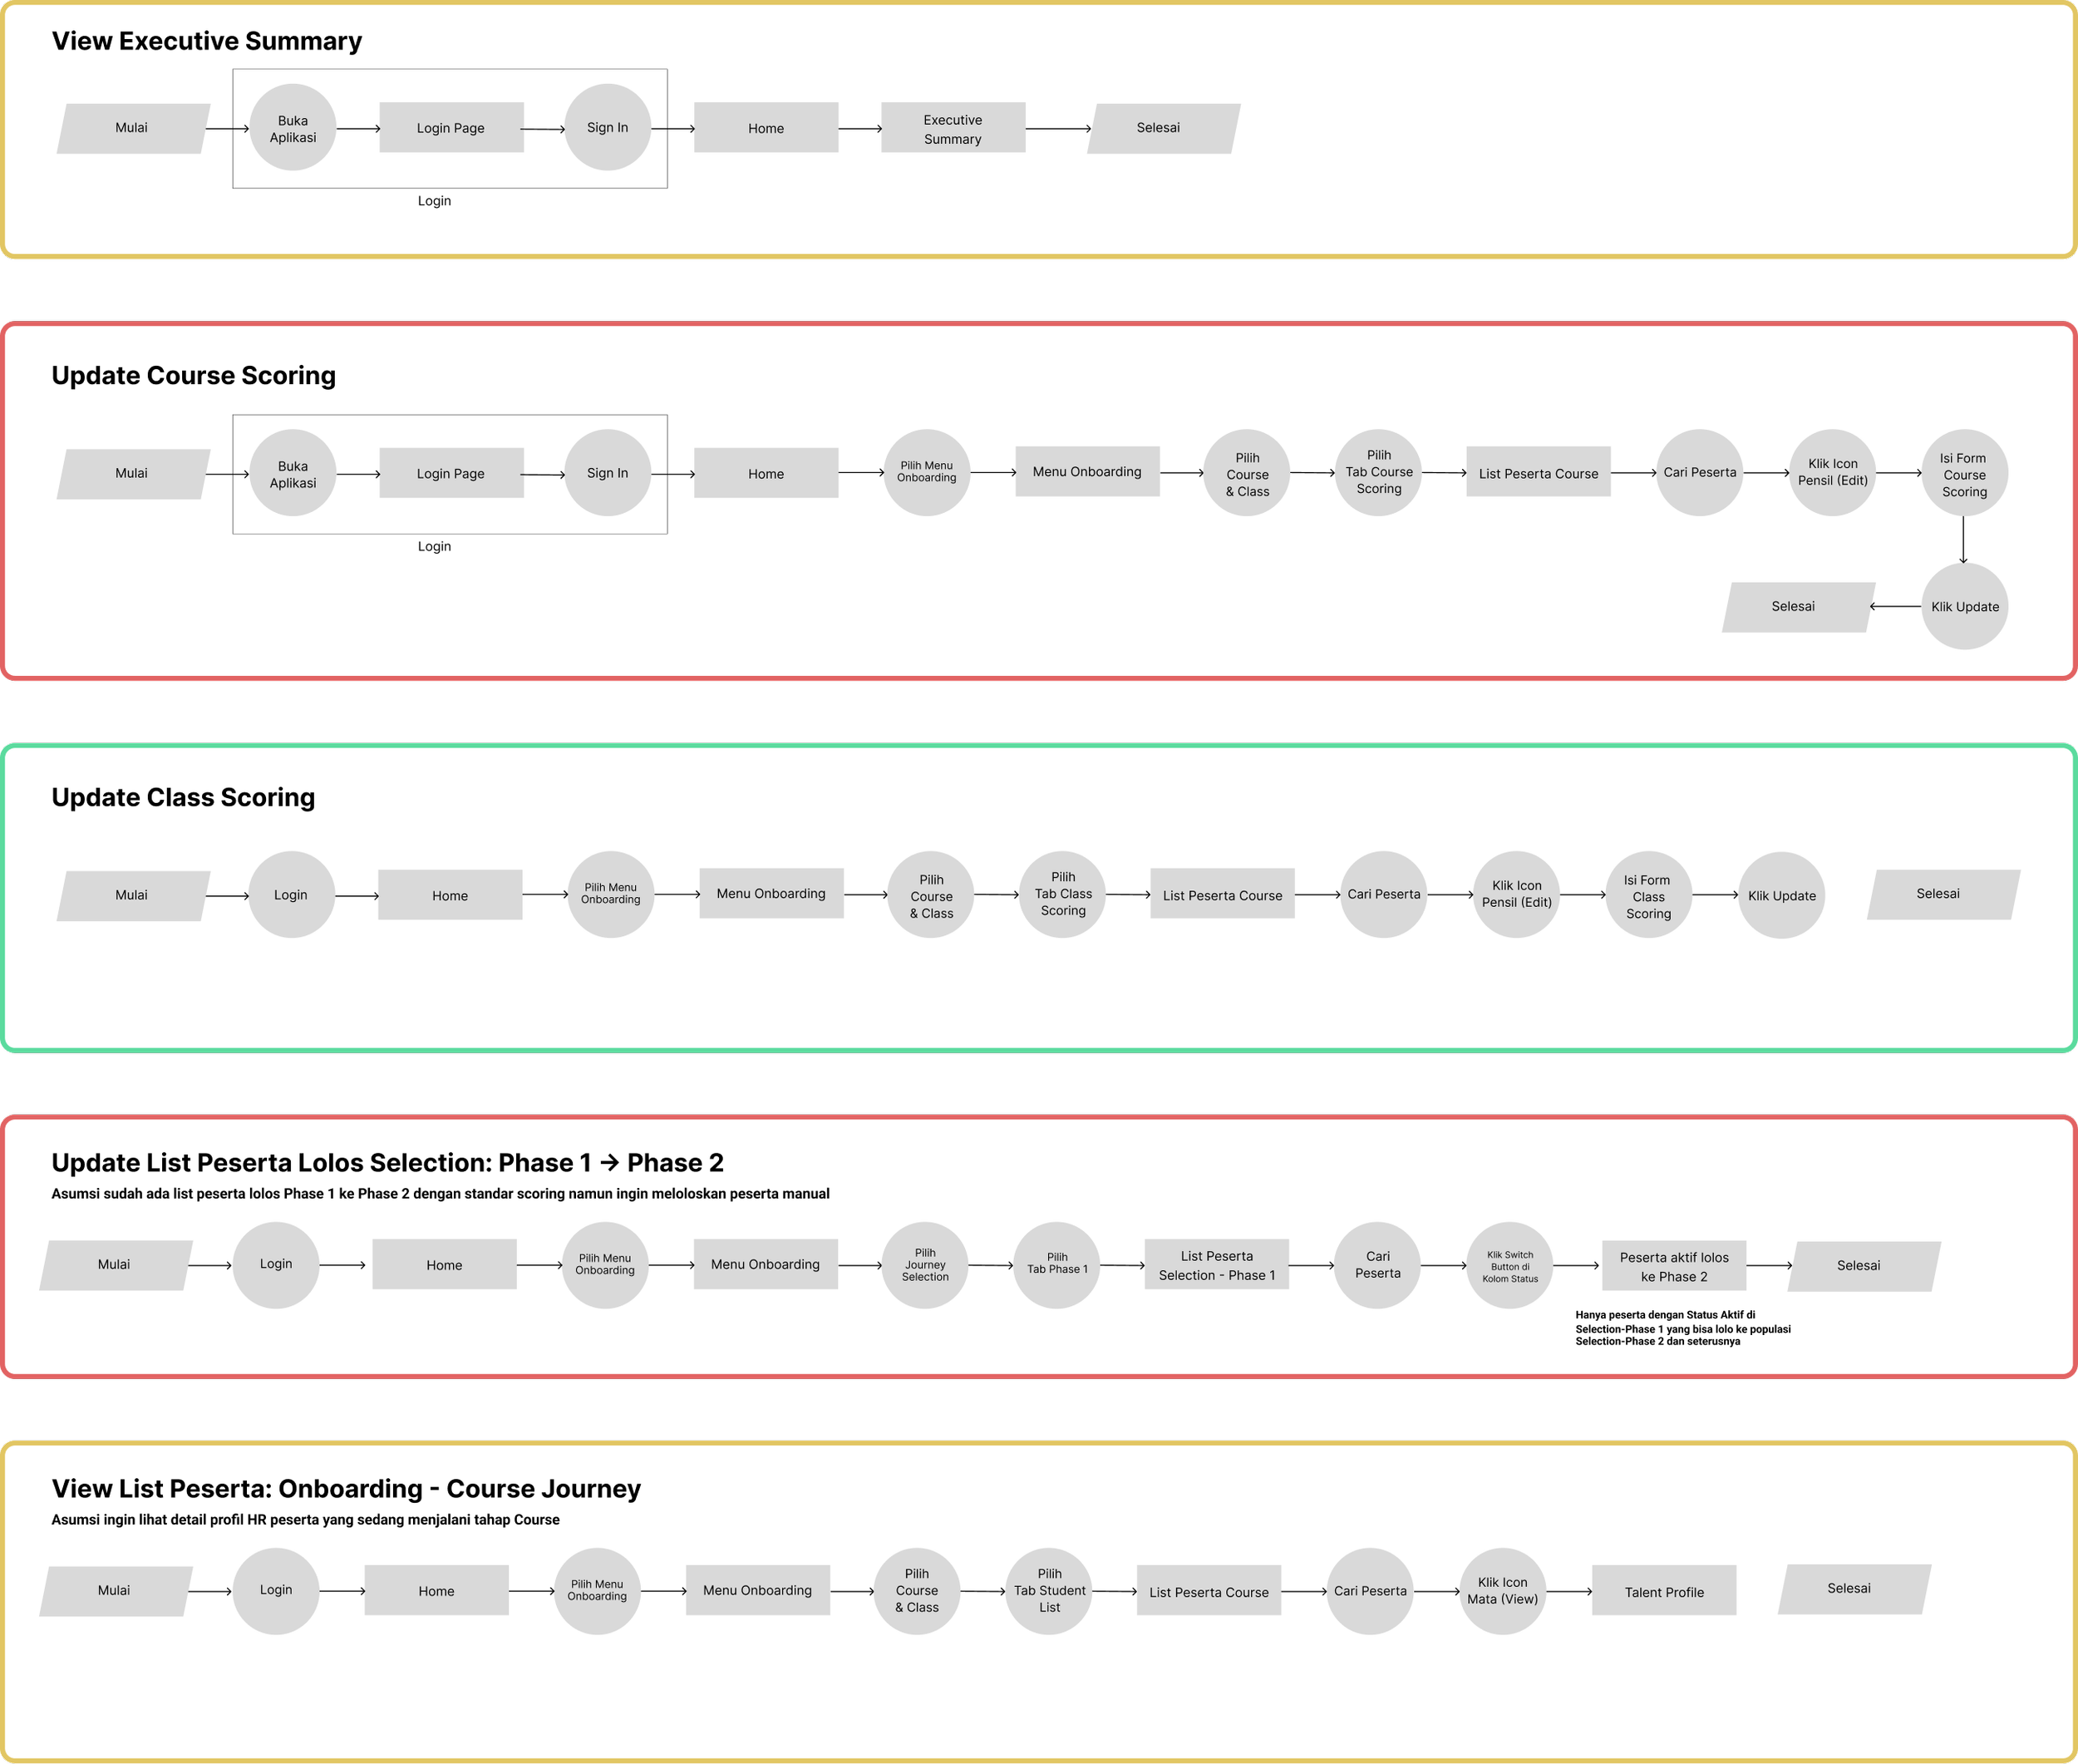
User Flow
From those features, we created 5 user flows to cover the steps users would take to accomplish specific tasks, highlighting the most efficient paths and identifying potential pain points.
Information Architecture
We mapped out the information architecture to define the structure of the dashboard, ensuring logical organization and intuitive navigation.

Structuring the Design
In creating the visual design, there are some considerations that we took during the design process:
1. Navigation Menu
Dashboard to accommodate overall and journey report summary.
Onboarding to accommodate journey progress from Selection, Course & Class, Competition & Celebration.
Post Event used as a repository to store all students and projects data.

2. Child’s Menu
The long process of Selection and Course & Class requires us to create a dedicated page for each journey progress, showcasing student list on that journey and managing the class & course scoring process.
We decided to create a child’s menu in Selection page, as well as Course & Class page.
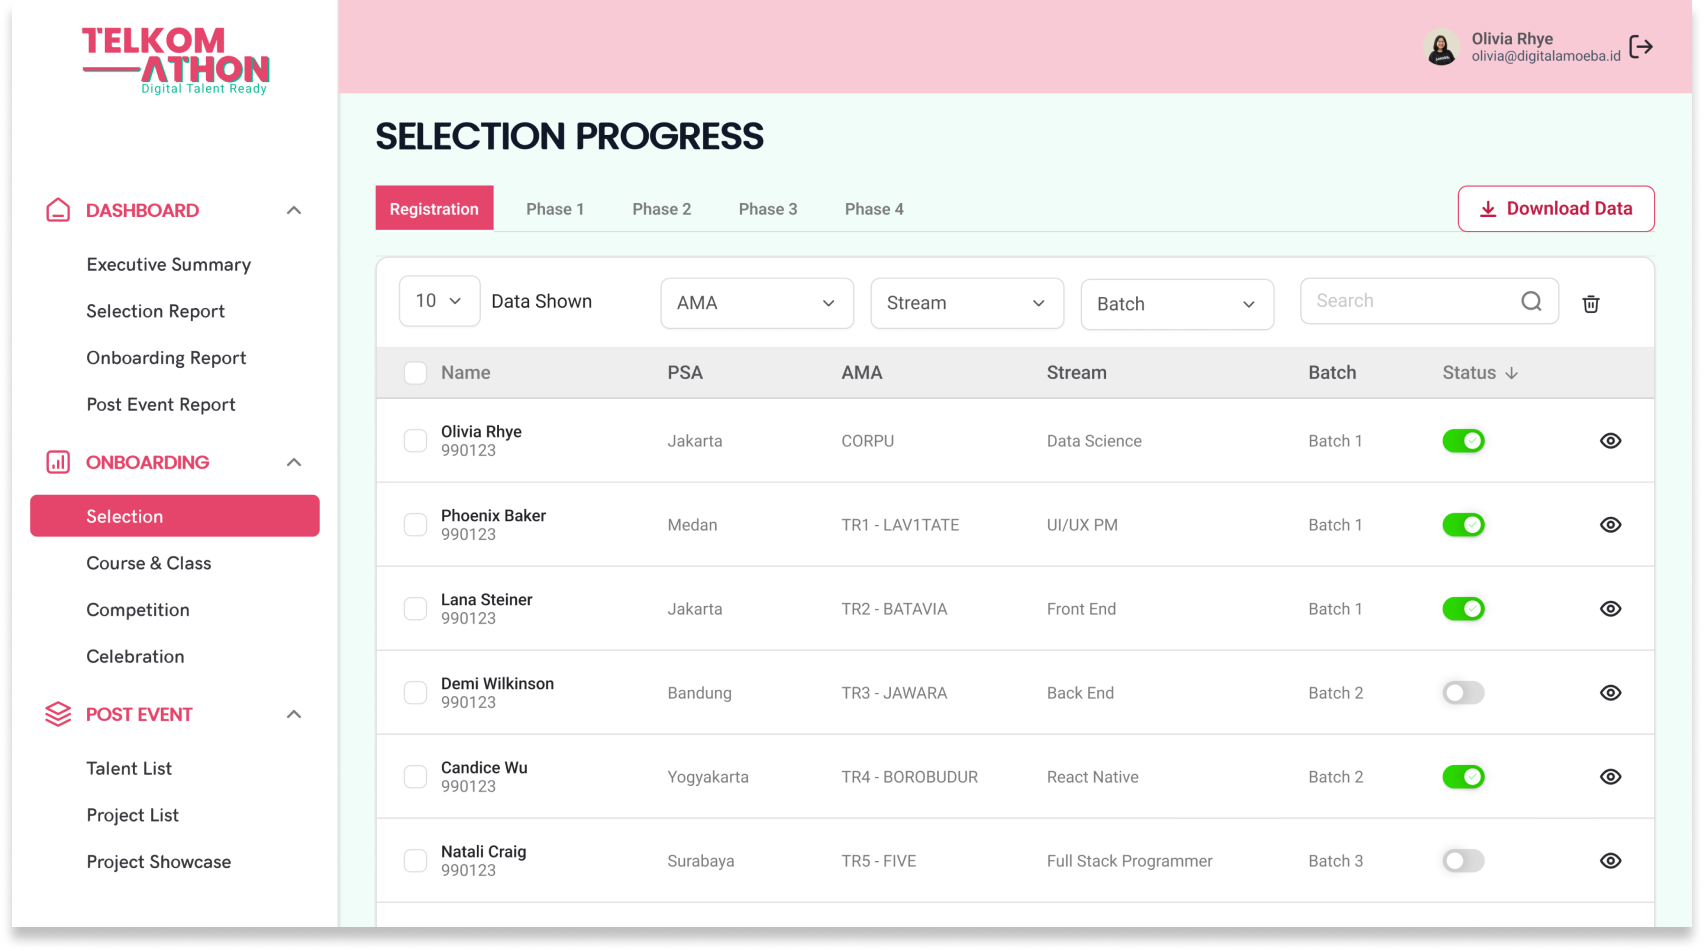
Selection page accommodate list of registrant information from each phase in selection process from Registration, Phase 1 to Phase 4.
Course & Class page accommodate the whole main journey of Telkom Athon from Student list, Course scoring, Class scoring, Leaderboard Course list and Class list.
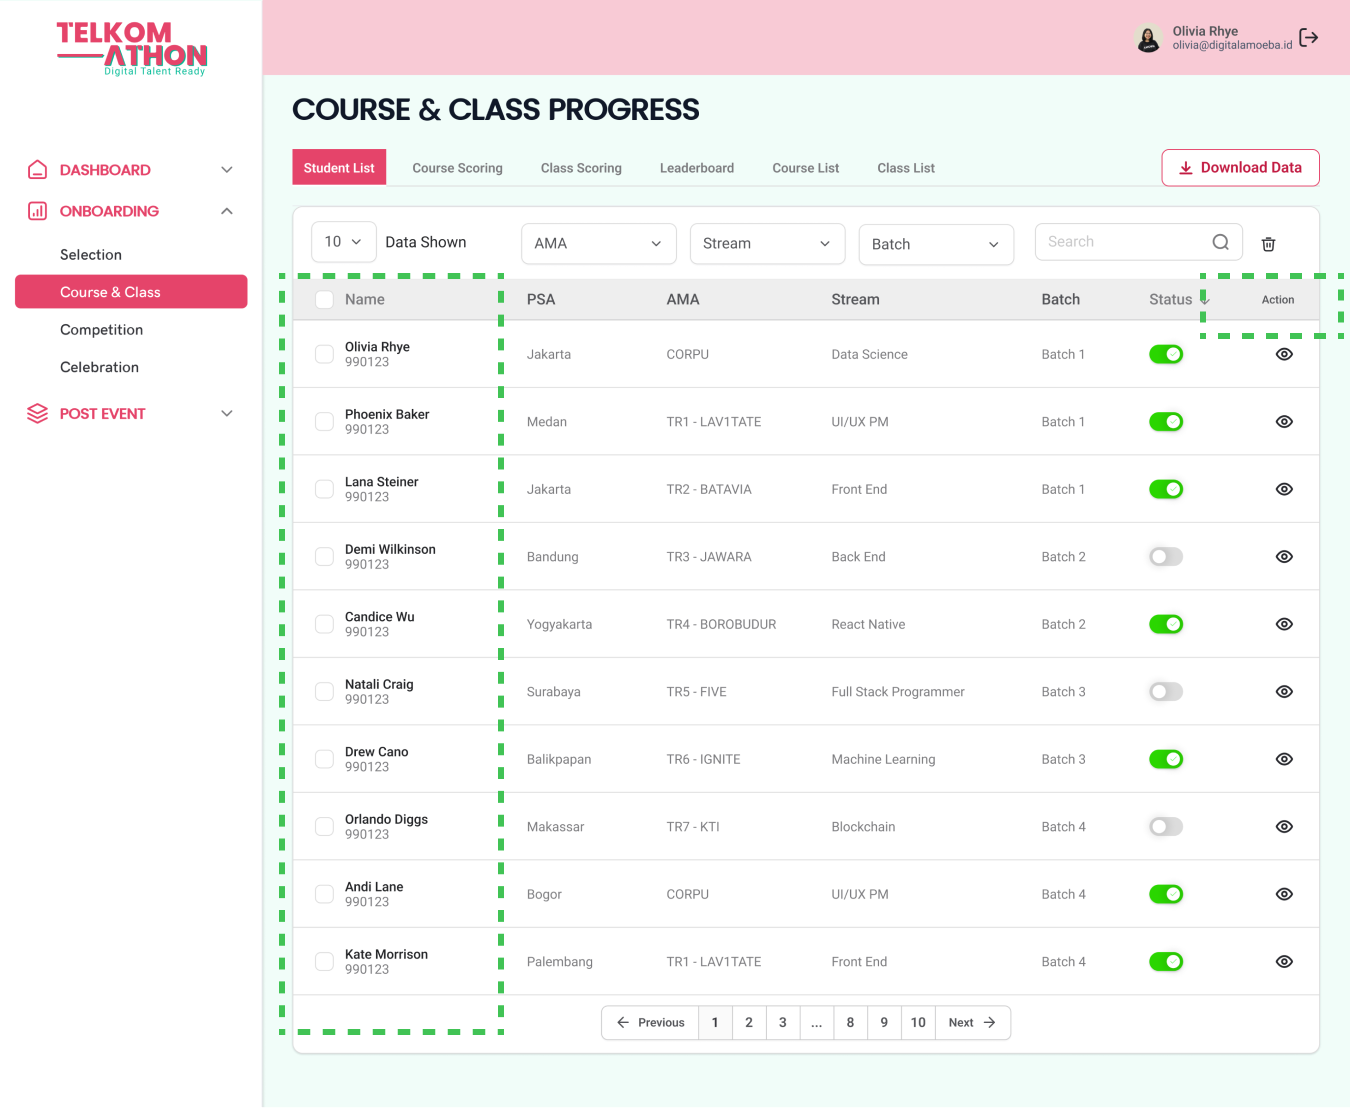
3. Moving Participant with Toggle Button
In every phase of the journey, Product Owner always create a list of participant document who pass through to the next journey, especially in selection phase.
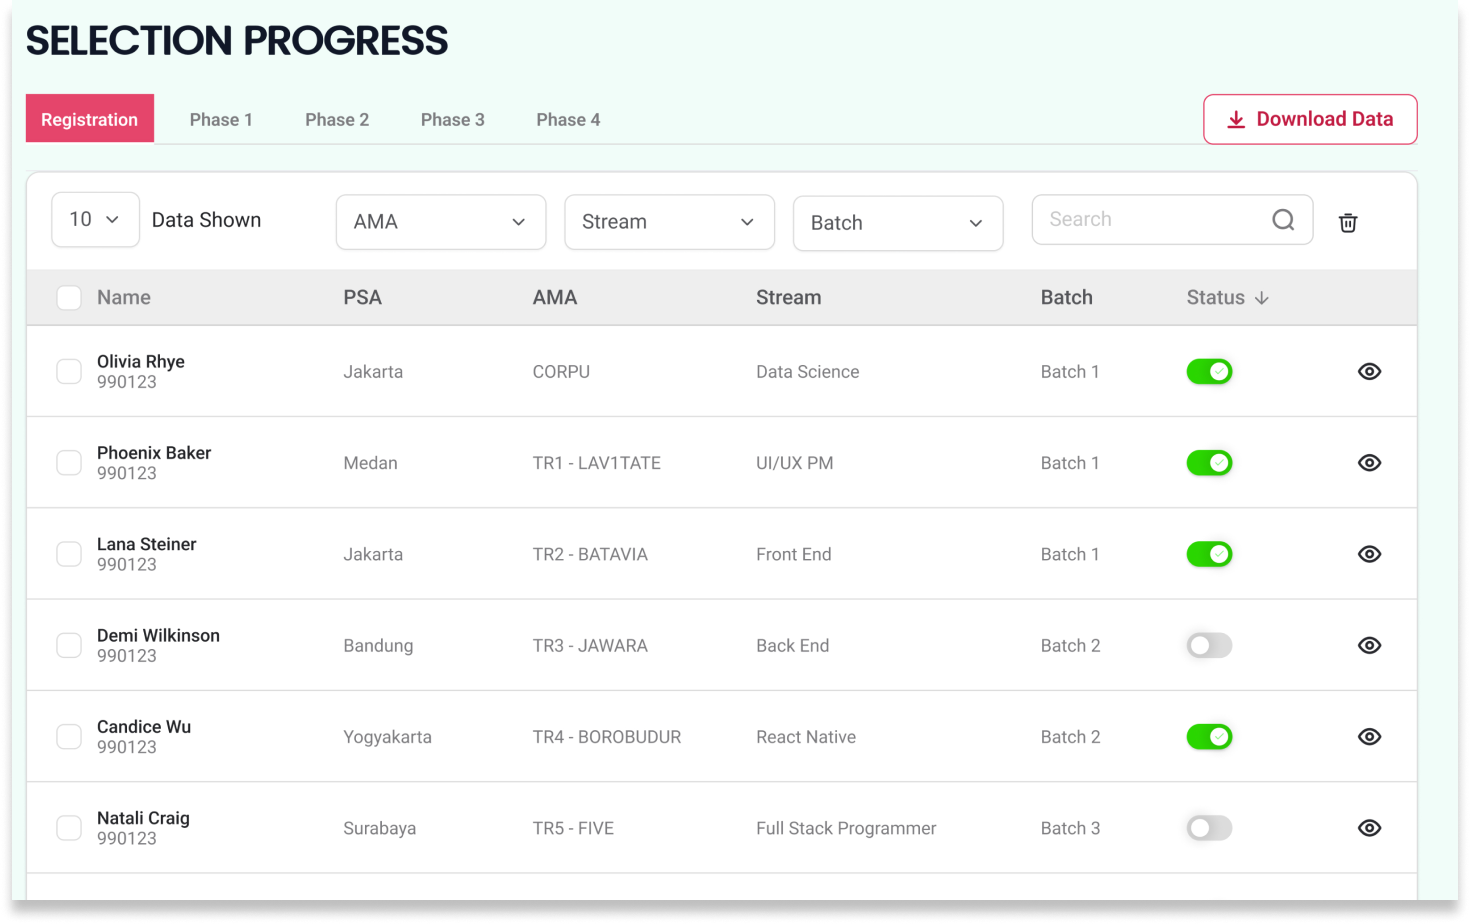
To simplify this process, we decided to use a toggle button for Product Owner to move participant data into the next phase.
Also, we put a check box on the left side to make it easier for them to do a bulk task in moving participants data.
But first, we make sure to our developer team whether they can create this algorithm or not.
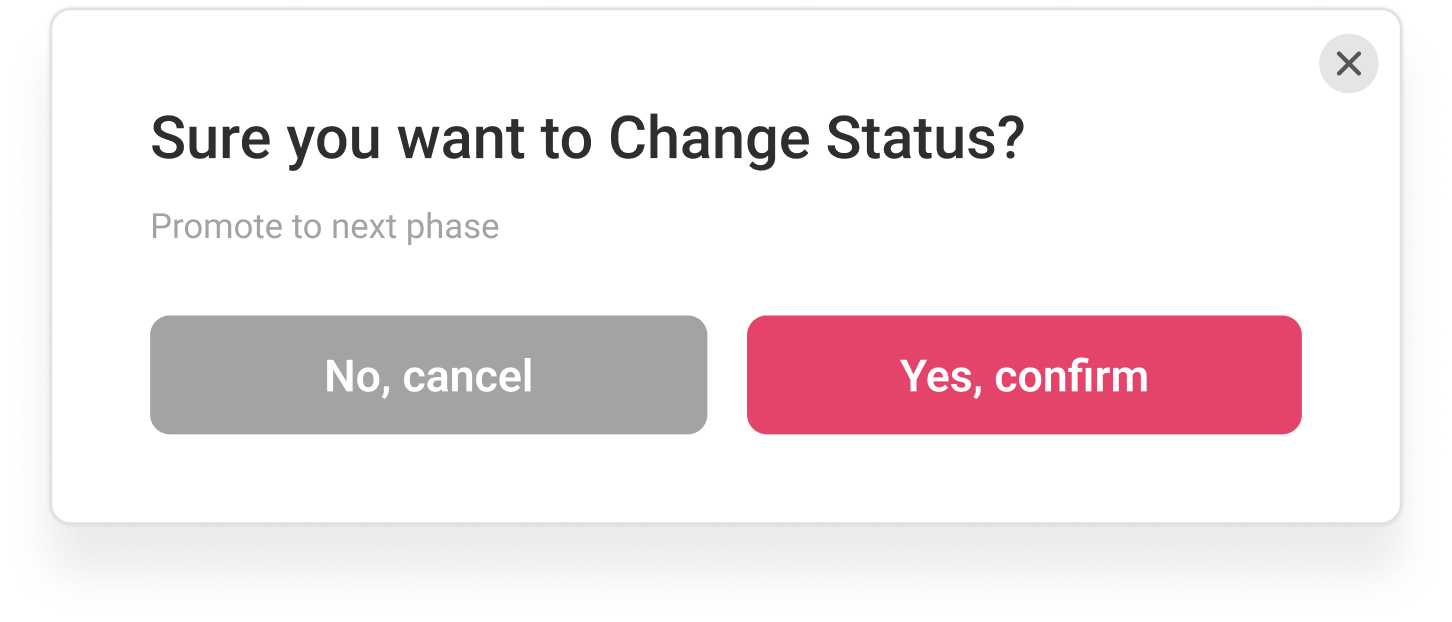
It is applicable but, turns out they need a trigger to activate this function.
It’s also needed to make sure Users are not going to miss-clicked the list of participant who go through the next phase.
So, we create a pop-up prompt as a confirmation.
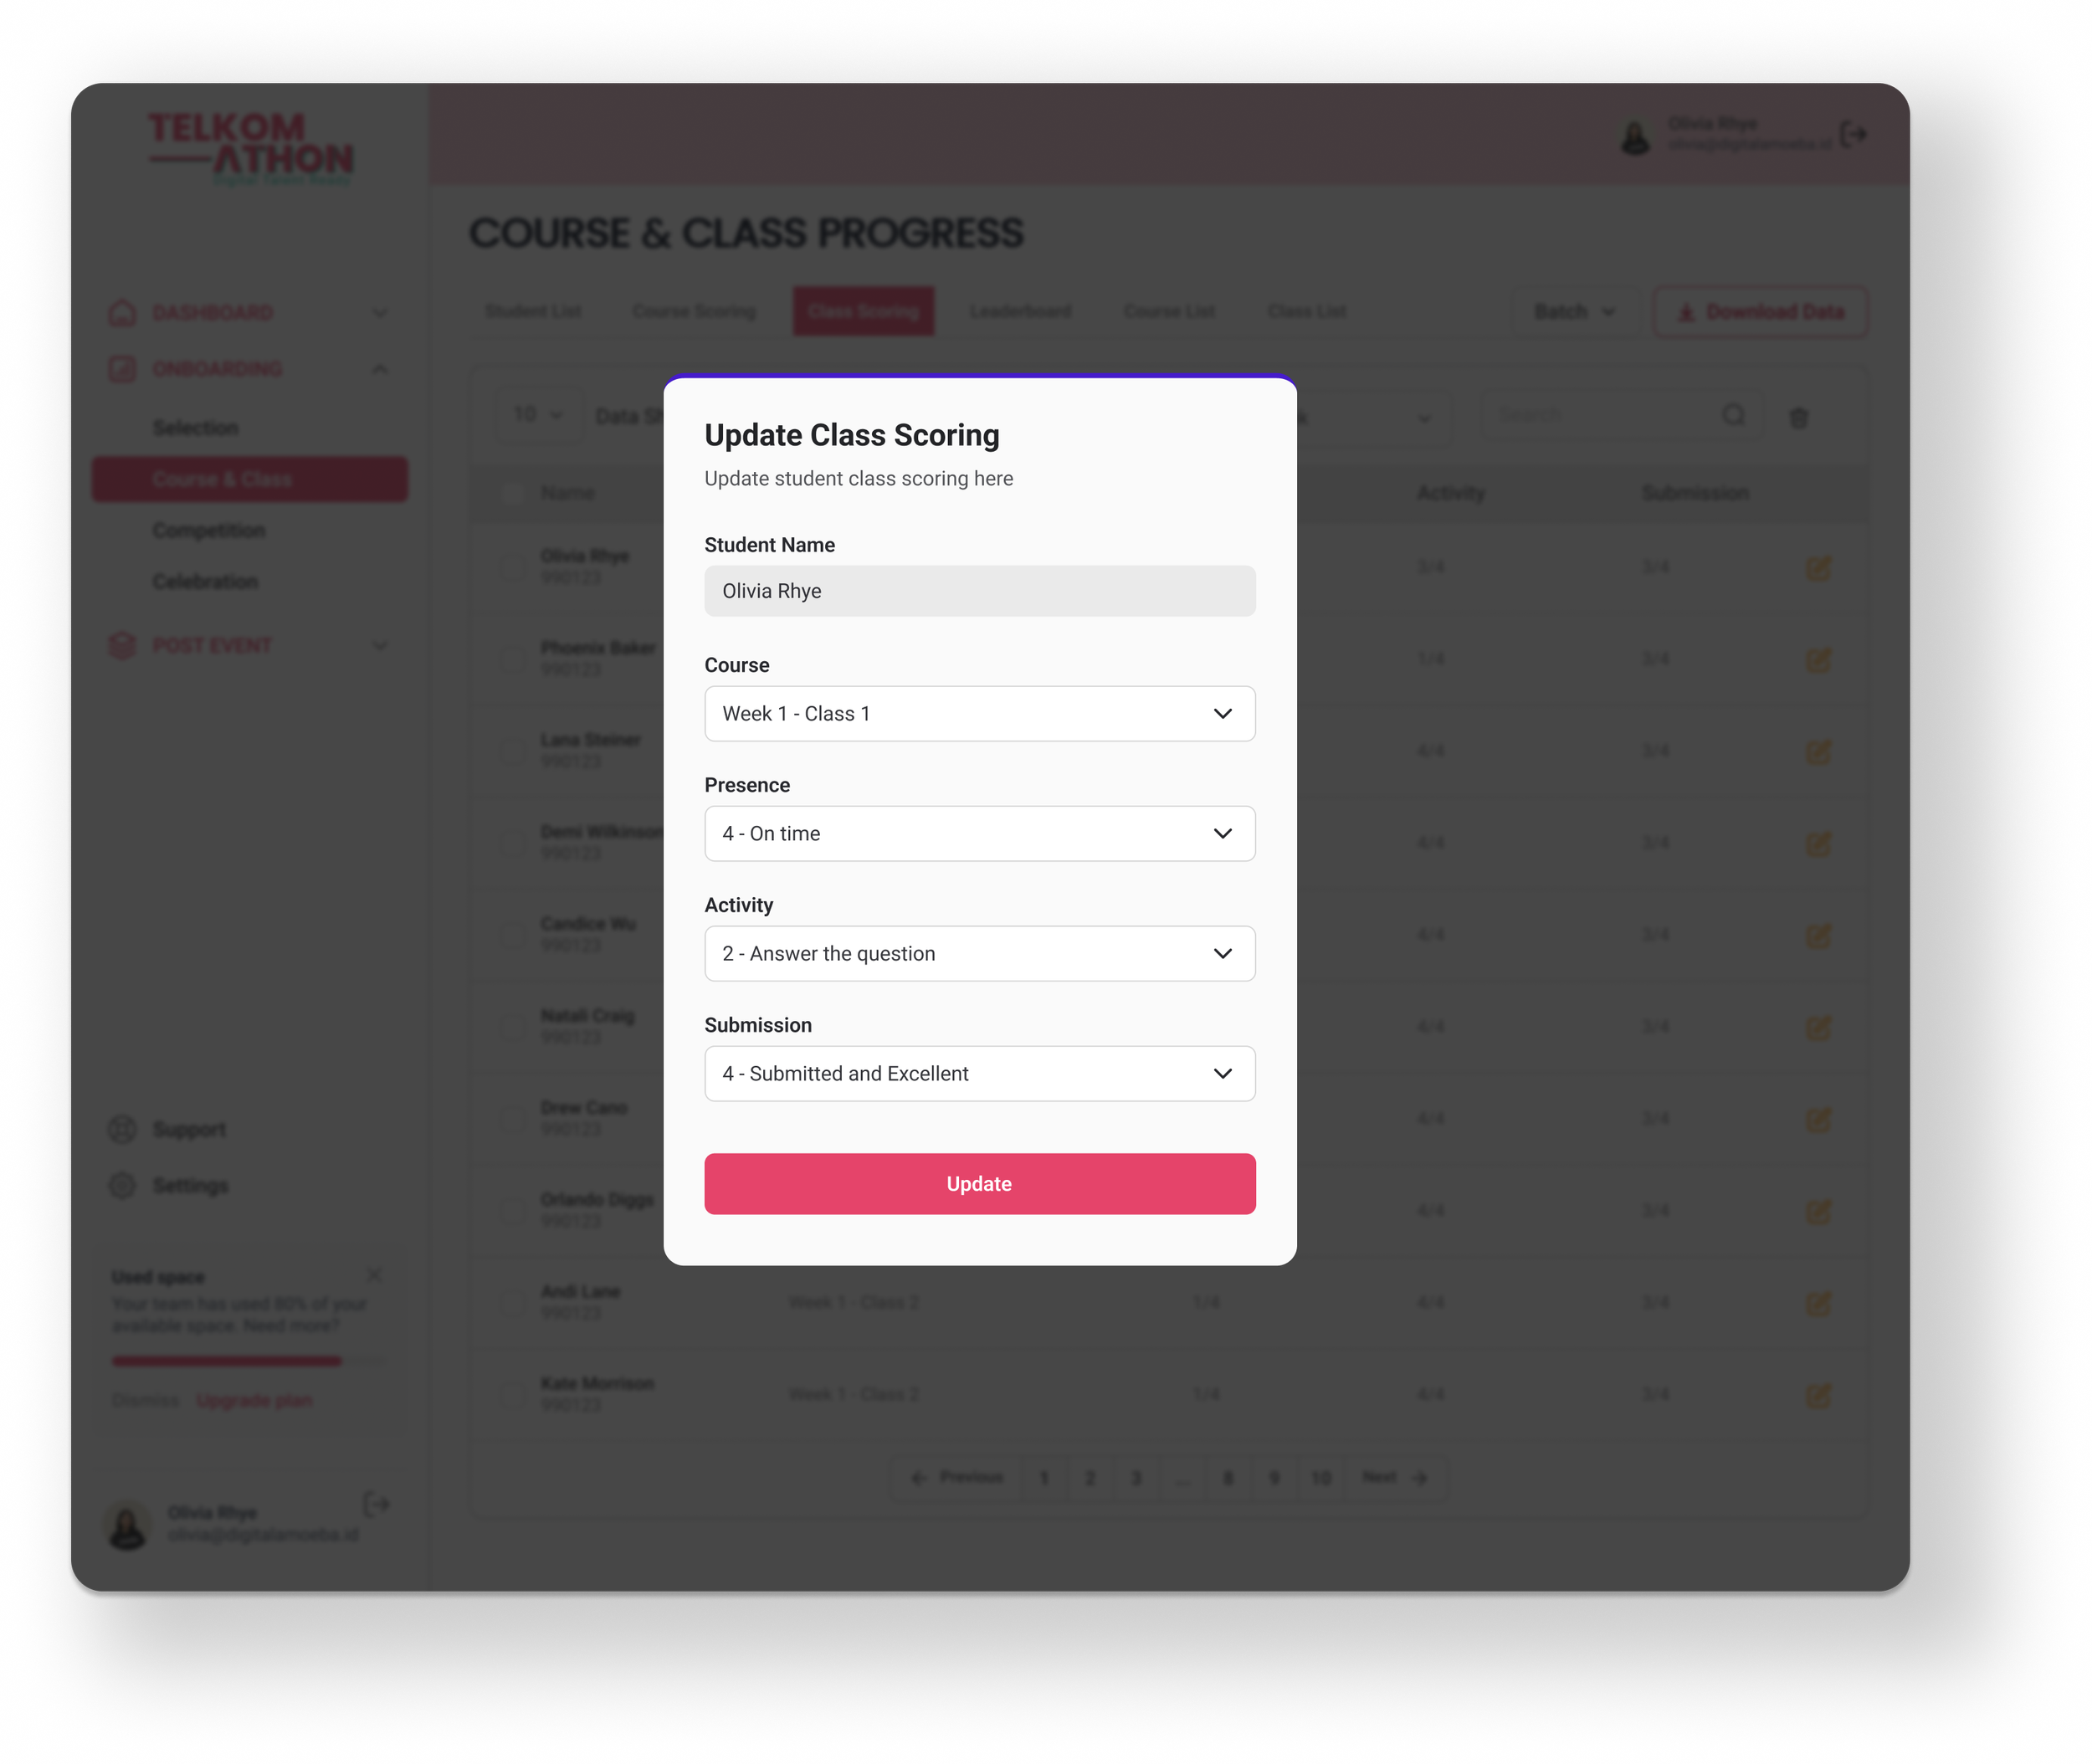
4. Student’s Scoring
Product Owners and Mentors are responsible to give a score for each student. The score then used to create a Leaderboard list for them to choose “Student of The Week” and “Student of The Month”.
By clicking the action button, instead opening a new page, we choose to create a pop up scoring page for them so they wouldn’t have to navigate to much when doing this task.

Usability Testing
We conducted a round of moderated usability testing on a high-fidelity prototype to validate the flow and gather feedback on the user experience.
From their feedback, we were able to identify some issues to be fixed and make key information more accessible at a higher level.

Design Iterations
1. Leaderboard page was considered as one of main information that Users look up to regularly
The Leaderboard page, which was previously a child of the Onboarding menu, has been moved to be part of the Dashboard child menu.
Before

After

2. Improve accessibility to view student detail
The feature to view participant profile details was previously only accessible by clicking the 'view' (eye) icon. Now, it can be done by clicking on the participant's name and the 'view' (eye) icon.
Before
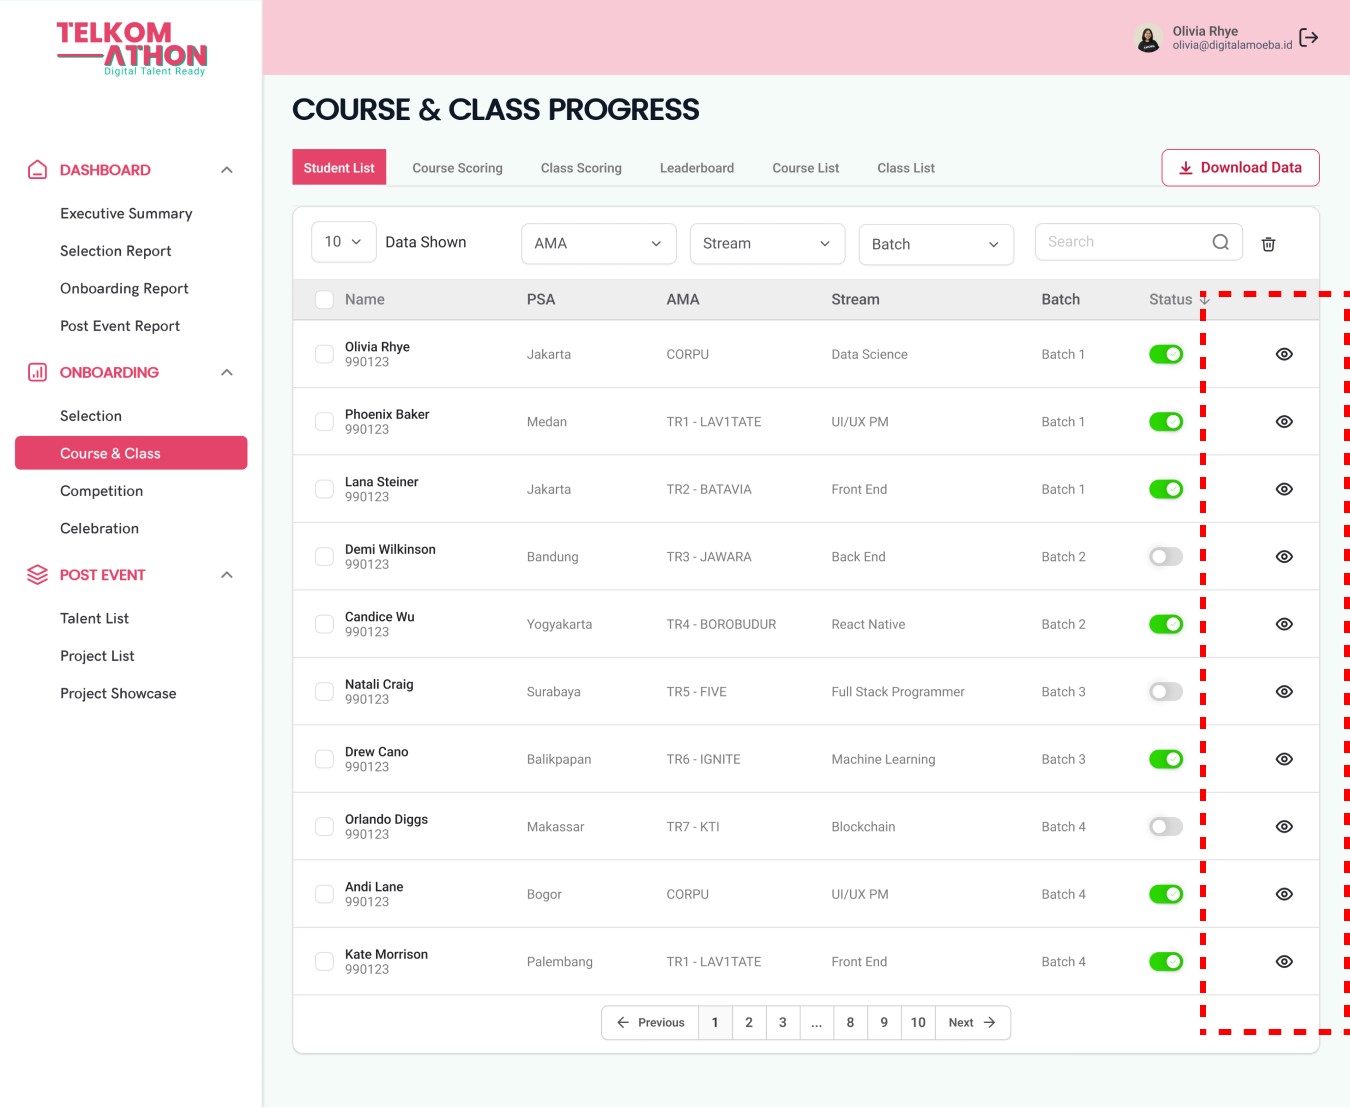
After
3. Updating language term used
The language term was adjusted to make it more familiar with the user journey. Previously, 'Phase' was used, which has now been changed to 'Filtering.'
Before

After

Reflection
Personal Learnings
During this project, I've got the opportunity to:
Learn more about developing a product from an existing mature program
Lead UX Team, improving my leadership skill
Work with Tech team (Back-end, Front-end, React Native), improving my communication skill
Conduct online usability testing
However, although this project is deemed successful, the best solution would be to improve our location datas.
Shoutout to all collaborators
Huge shoutout to everyone I collaborated with during this project
Product Manager - Fizri
UX team - Dita, Maiziah, Alya
Tech team
Product owner and stakeholders
and many more others.